Creating a Dashboard for Reports
Through the Dashboards![]() Graphical report of various customizable data and functions., your Sage XRT Solution platform and modules open directly on the data you choose, displayed in various forms.
Graphical report of various customizable data and functions., your Sage XRT Solution platform and modules open directly on the data you choose, displayed in various forms.
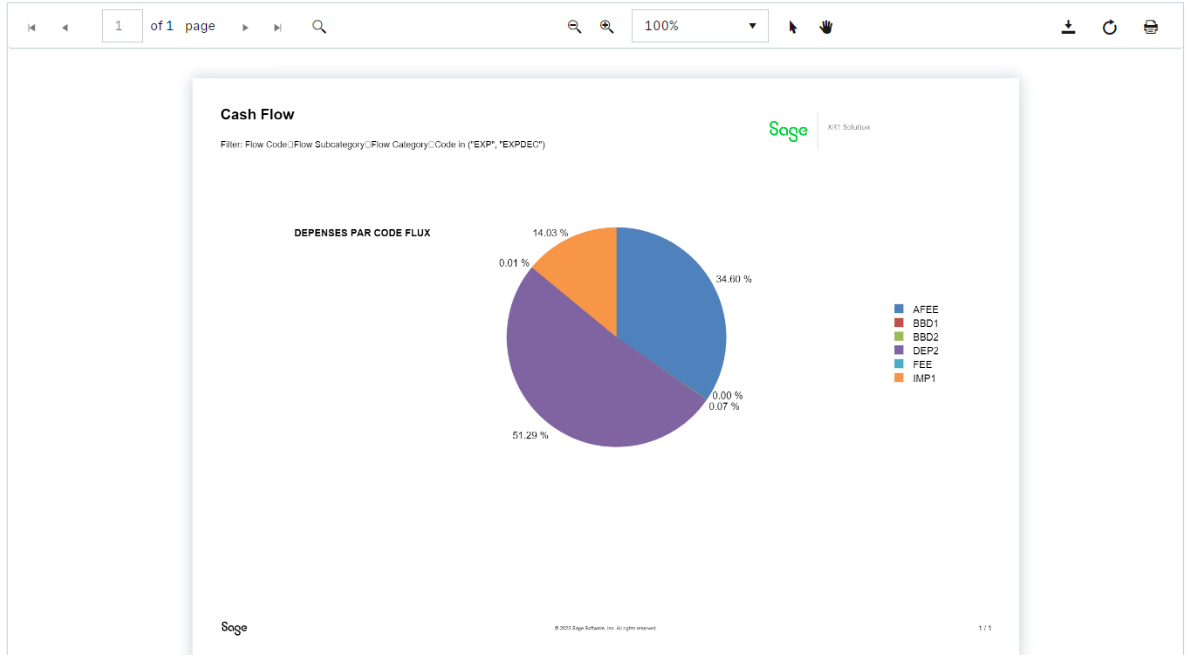
You can create a dashboard dedicated to Grid reports.
After the creation of a grid report, you can save it as a portlet within a new dashboard.
-
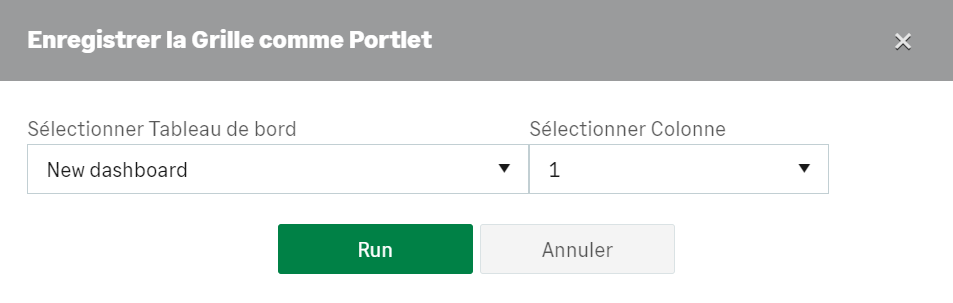
In the More dropdown menu at the top of each page, select Add Grid Portlet from the Dashboards section.
A window opens.
-
Select Create new Dashboard... and click the button Save.
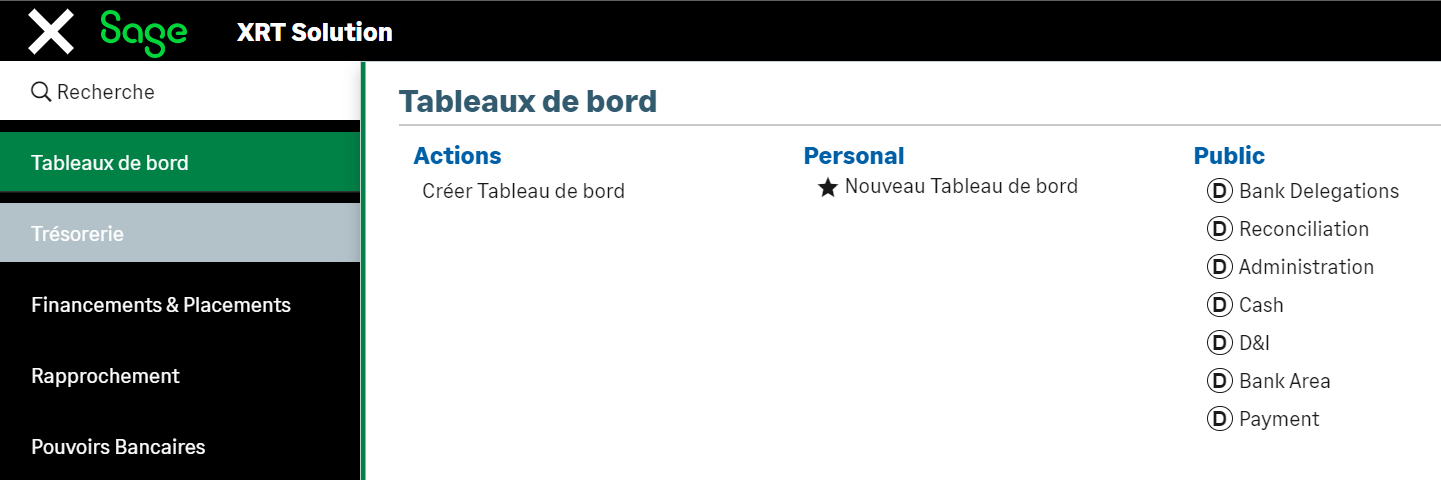
Refresh the page and your new dashboard appears in the Dashboards tab of the main menu.
-
Open it for modification.
-
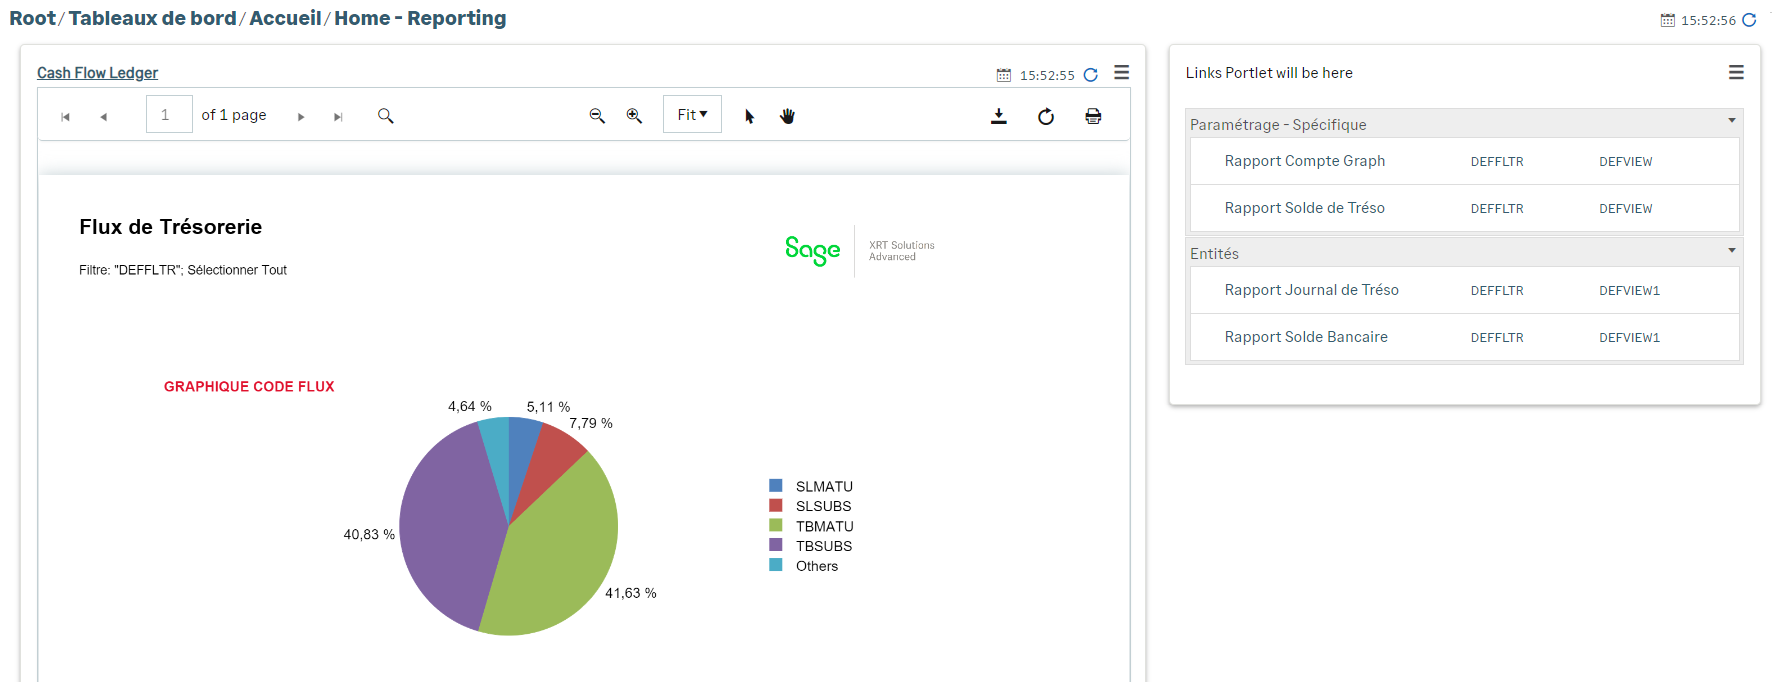
In the Dashboard Editor, replace the default name by Reporting.
Select the view and the filter corresponding to the report and click Set.
In the dashboard, the Links portlet enables the quick display of reports in the viewer.
-
In the Dashboard Editor, add a column in the Columns field, then drag and drop the Links Portlet icon to the indicated area.
-
In the new framed section, click the Add Link button and select the module and the menu hosting the target report. Select the submenu, the view and the filter depending on the case.
-
Click within the text area et customize the name of the target report to spot it quickly.
Add as many links as you want by repeating the last operations.
You now have a Reporting dashboard with quick access to your reports.
Info
You can also add Grid reports in the existing dashboards. You just have to follow the same process, selecting the target dashboard in the window for grid portlet saving at step 1.
For more information on Dashboard Setup, see the Creating Dashboards topic.