Introducing Views
The platform offers different levels of personalized display for the data.
This topic presents the notion of view.
Roles
On the platform, views![]() Customizable display of organized information in various forms. enable you to display all the data you are interested in on a single page, through a flexible presentation: selection of columns and linked filters, grouping, color or font formatting and charts.
Customizable display of organized information in various forms. enable you to display all the data you are interested in on a single page, through a flexible presentation: selection of columns and linked filters, grouping, color or font formatting and charts.
You can create a view directly from each function.
Important
When you use the function for the first time, the default filter and view, DEFFLTR and DEFVIEW, in each table on the platform do not include any filtering condition: all the data are displayed.
Setup Overview
To start creating and modifying views, spot the View area on top of the grids![]() Table presenting a set of numerical data..
Table presenting a set of numerical data..
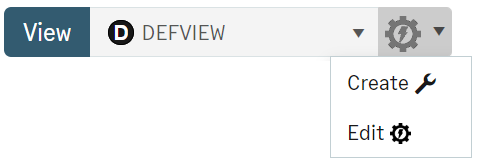
Click the View blue button on the left side of the area or the configuration button  on the right side, then select Create to open the creation form for views.
The following paragraphs describes the general settings to select.
General Settings
The top portion of the form gathers the basic elements for the view.
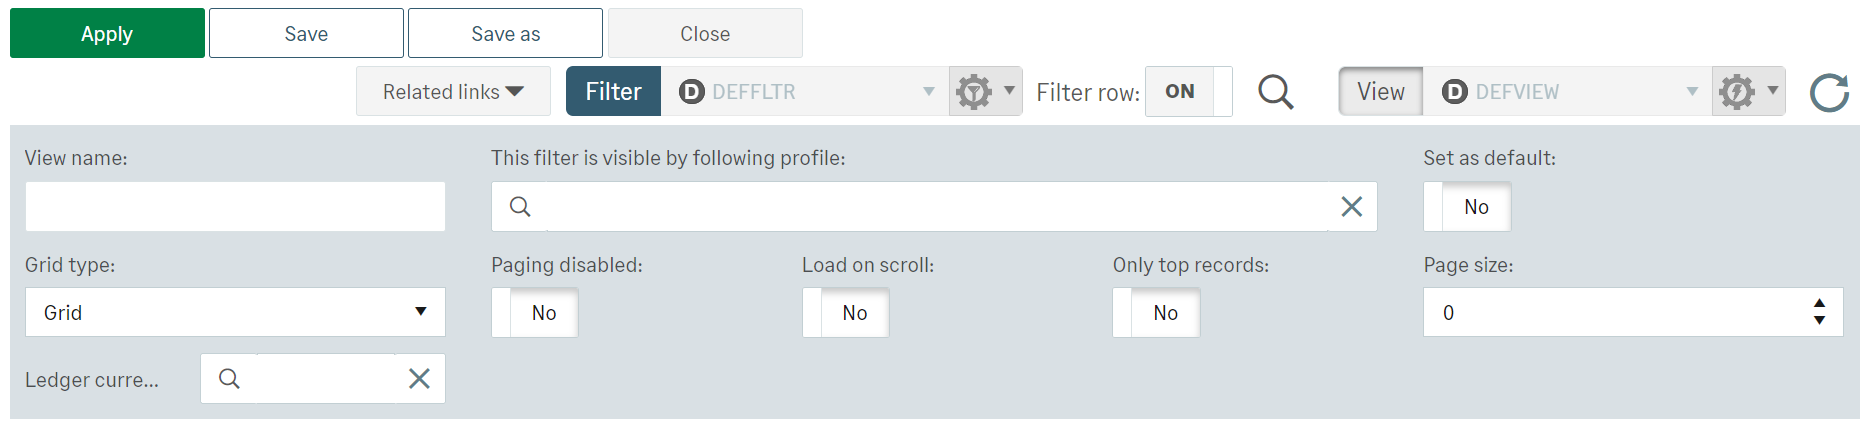
Enter a name to identify your view.
We strongly advise to use different codes for the different tables in order to avoid any error during filter![]() Function processing information to extract a smaller but relevant amount of data. exports or imports.
Function processing information to extract a smaller but relevant amount of data. exports or imports.
Select the visibility profile from the three options: Public, Group, Private.
You can make the view you are creating the default view by activating the option with the same name.
Info
Once you created a view, its basic elements cannot be edited.
Then select the form you want for your data.
The Grid type corresponds to the standard display of cash ledgers.
With the Pivot table type, you can combine data grouped by dimension. These data can be exported into an Excel pivot table![]() Statistics tool that summarizes a data table and reorganizes its data using mathematical functions and dimensions.. This type grants access only to the Column tab and the Afficher Cumuls option.
Statistics tool that summarizes a data table and reorganizes its data using mathematical functions and dimensions.. This type grants access only to the Column tab and the Afficher Cumuls option.
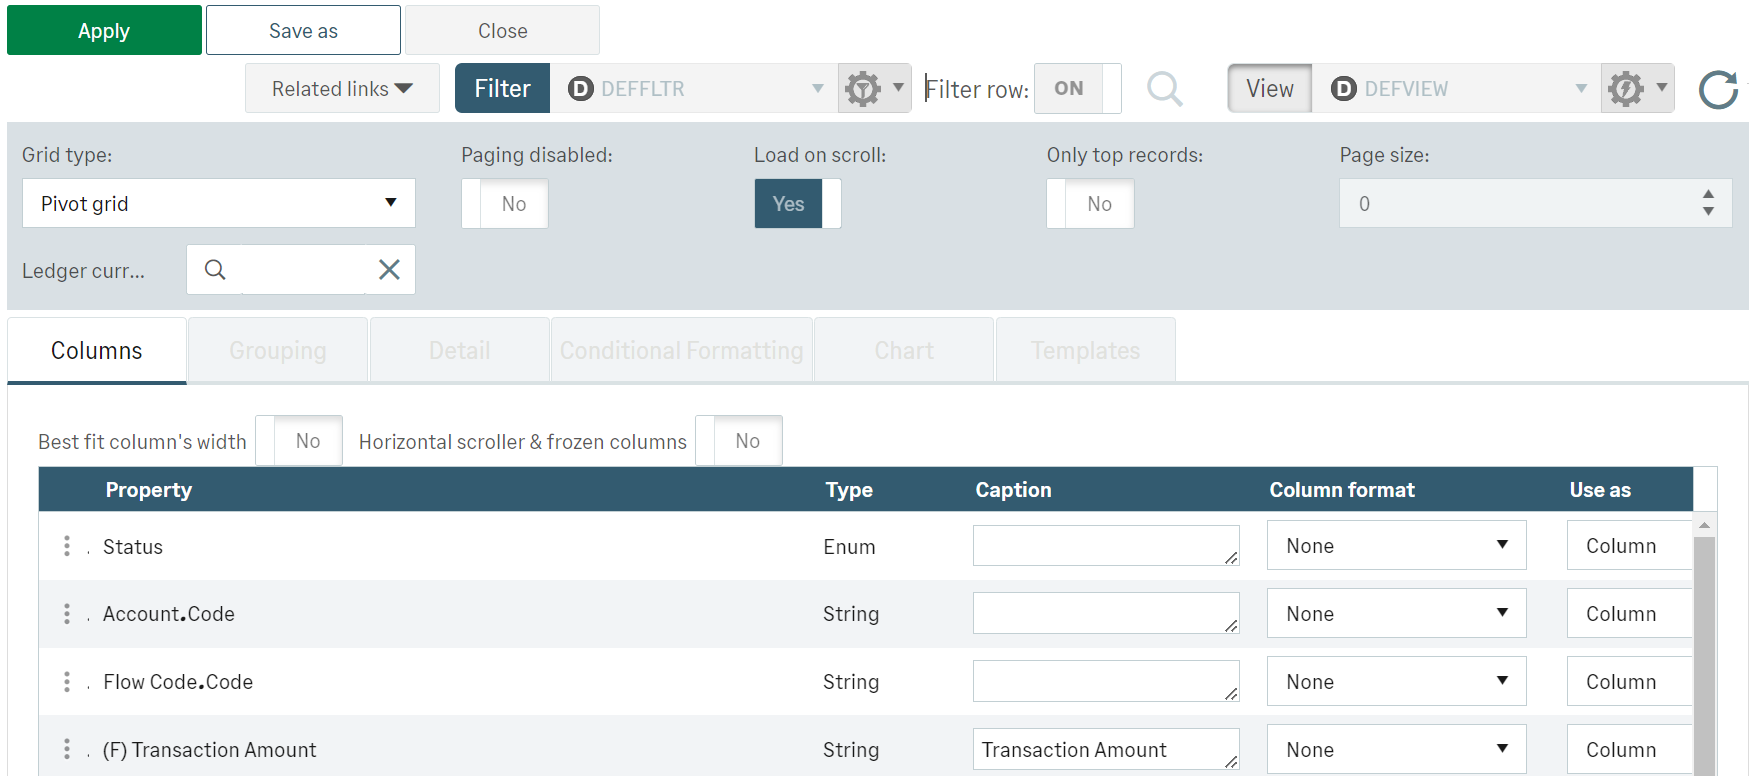
The Paging disabled and Load on scroll options must be both activated or deactivated within the view. When only one of these options is selected, performances can be deteriorated.
These options enable you to go from paging to load on scroll![]() Action of moving displayed graphical elements up, down, or across on a computer screen..
Action of moving displayed graphical elements up, down, or across on a computer screen..
Important
The Load on scroll mode enables chart creation, but forbids data grouping.
The load default value is limited to 50 lines, but you can modify this in General Parameters in the Configuration menu of Administration.
The Only top records option enables to display only the number of lines defined in the Page size option. When the grid is designed for a dashboard (for example to display the ten last transactions), activating this option enables you to limit the number of lines displayed through the Page Size option.
The page size is limited to 20 lines, but you can modify this in General Parameters in the Configuration menu of Administration. This field enables you to define a number of lines specific to a view and to ignore the general setup of the Administration module.
Info
This number does not correspond to the number of the lines actually uploaded which can be higher and is defined in the General Parameters of the Administration module.
If you want to display balances in the ledgers, select the conversion currency for the calculation from the Ledger Curency list. This option is particularly valuable for charts.
The bottom portion of the form gathers the specific characters of views in tabs. To complete the setup, see Setting up Views.