Setting up Views
This topic describes how to create your views after the general elements setup.
The powerful platform is based on the classification of extensive data. This structuration forms a relational tree view which organizes data among them.
The bottom portion of the form gathers the specific characters of views![]() Customizable display of organized information in various forms. in tabs.
Customizable display of organized information in various forms. in tabs.
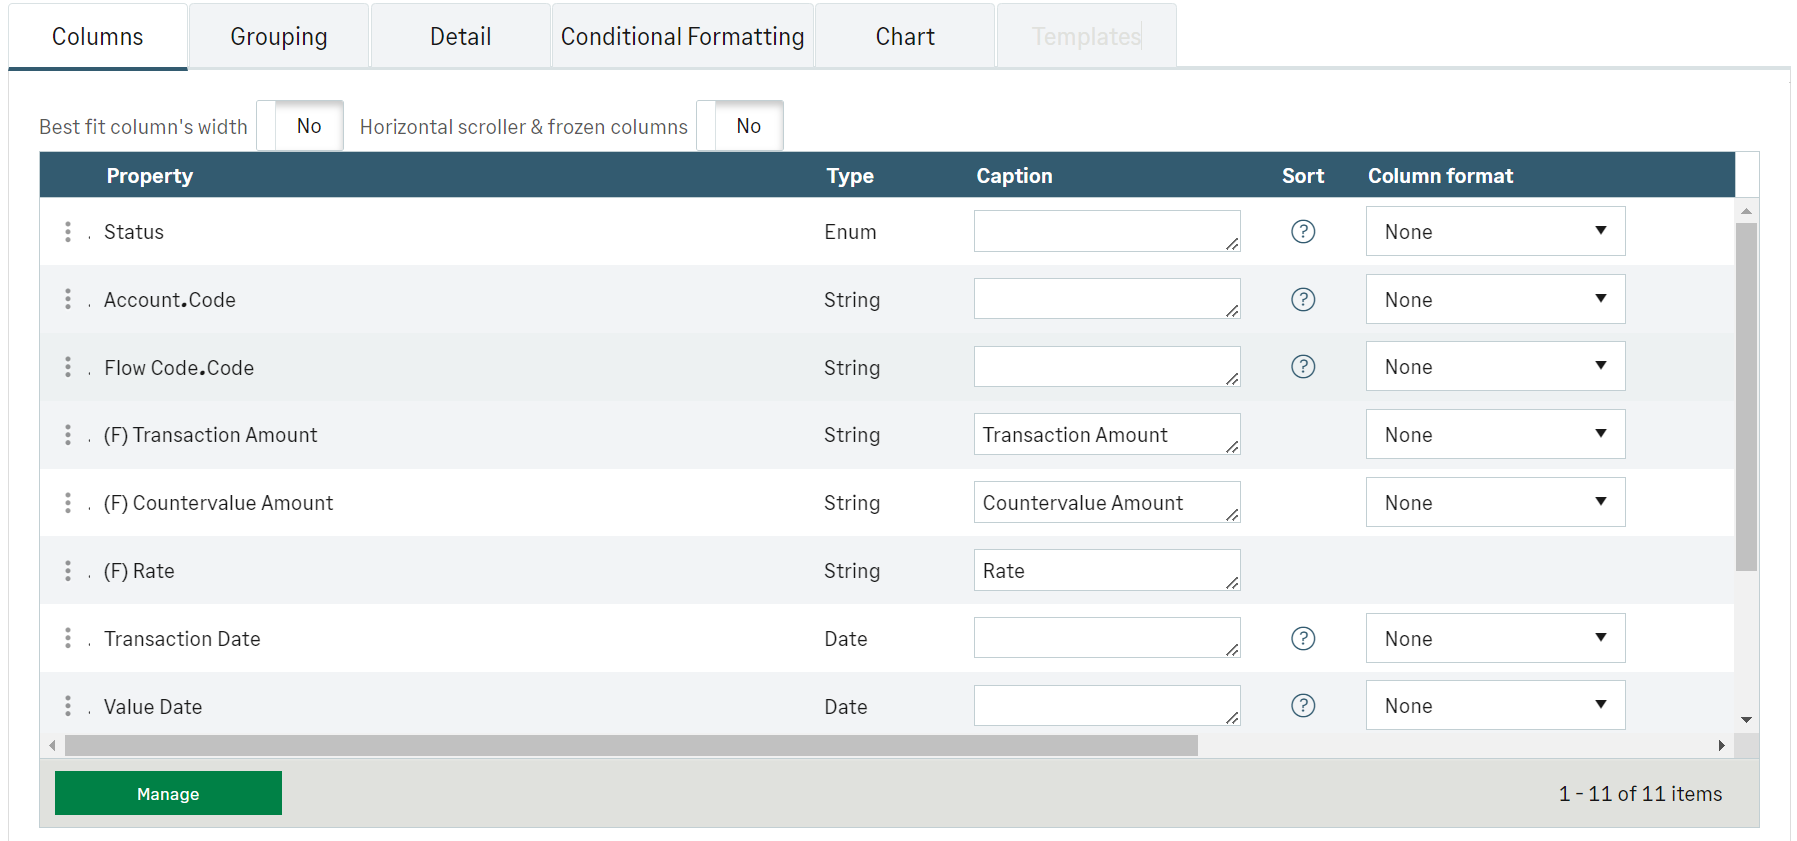
In the Column tab, the first two options manage the display of columns.
The width of each column is automatically adapted to the contents when the button is set on Yes. The automatic adjusting option is activated when the option Horizontal scroller & frozen columns is activated too.
This second option called Horizontal scroller & frozen columns enables the horizontal display and the freezing of columns. This locking process can be accessed through an option to select in each column, set up in the table.
We recommend you activate the horizontal scroller when you want to display numerous columns.
Info
The manual adjustment of columns is also possible. Your choices are saved into your browser's cache.
If you want to add or modify columns, click the Manage button.
The window which opens up, presents the relational tree view i.e. the structure of data categories for the current module. All the categories, called properties, together with their relationships are registered.
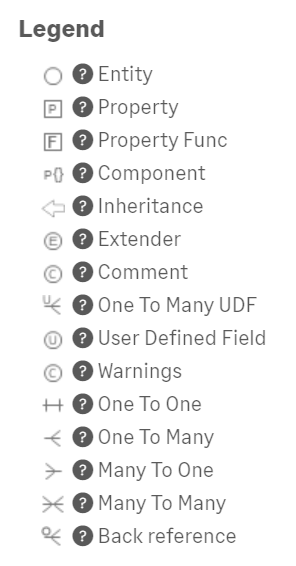
Click the information button  to view the definitions of the symbols used in the tree:
A large number of combinations are available.
For an efficient view, make sure the relations between the data you selected are consistent.
Info
You can set up the entry of comments for every ledger on the platform.
To activate it, add the field Commentaire.Commentaires.ID with Count as Column Format.
The Grouping![]() List of elements with a common characteristic. tab enables you to gather various data by category for an improved viewing.
List of elements with a common characteristic. tab enables you to gather various data by category for an improved viewing.
Subgrouping is also available, for instance by company and by bank.
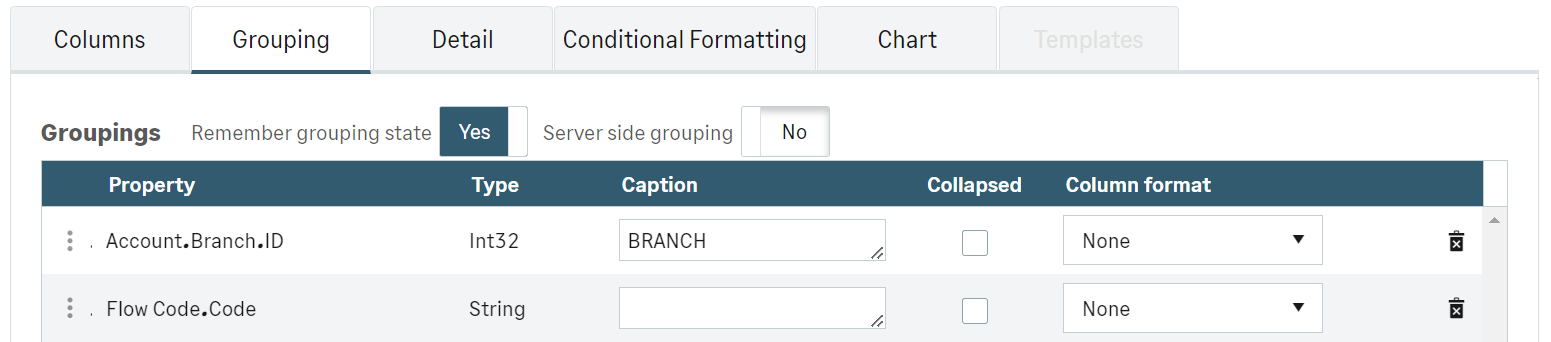
The option Remember grouping state enables you to save the manual expand/collapse actions in the grid![]() Table presenting a set of numerical data..
Table presenting a set of numerical data..
The option Server side grouping displays the table in collapsed mode. The client side expanded view is available on demand.
Info
Activating the option Server side grouping can further optimize the platform performances.
To create grouping, click the Manage button at the bottom of the tab.
The complete list of data categories called Properties is displayed.
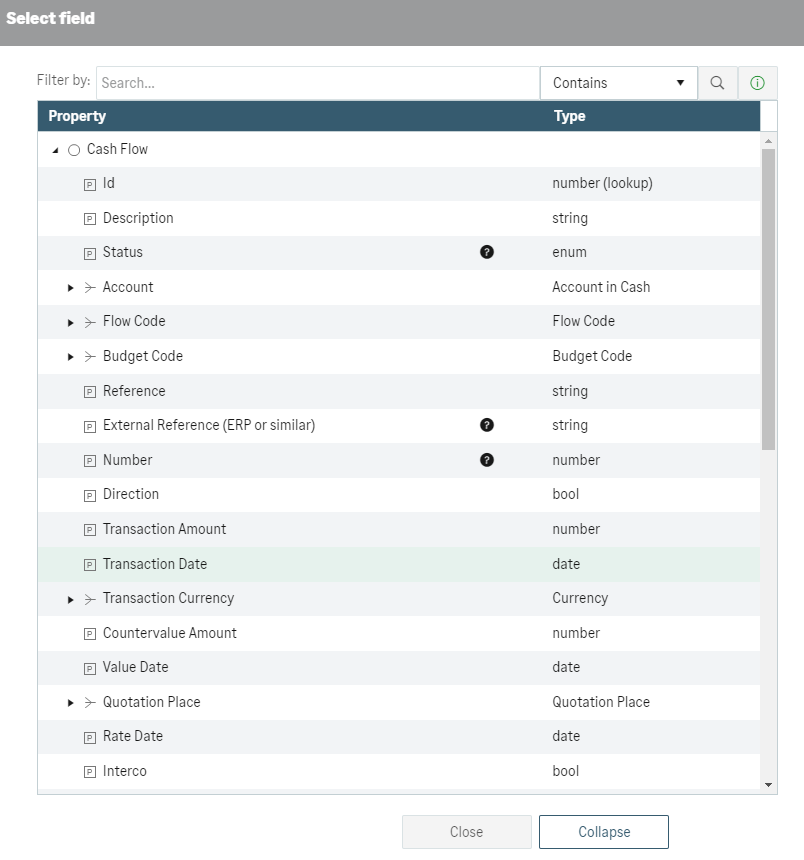
Click on the one you want: it is automatically added as a grouping criterion in a new line under the Property header.
Some options depend on the property Type. For example, the aggregate![]() Data with the same nature grouped to obtain a global result in a statistics table. options are available only for the data of the measure type. To set up aggregates, click the Aggregates button. In the new window, define the fields.
Data with the same nature grouped to obtain a global result in a statistics table. options are available only for the data of the measure type. To set up aggregates, click the Aggregates button. In the new window, define the fields.
The total number of the displayed lines is specified in the location selected in the Display column.
The counting options depend on the chosen field:
-
Count where lines are counted.
-
Count distinct where the lines with a distinct property are counted.
-
Max and Min
-
Sum and Average
When you have more than one grouping, you can Apply aggregate only for last grouping level.
Once you defined and saved your view, the table is displayed according to your choices.
This tab enables you to display the links to another entities. Here are the kinds of links: One To N and Reference.
Example
-
Transactions and Flows
-
Bank Branches and Accounts
-
Reconciliation Process and Rules
-
Bank Files and Bank Statements
-
Bank Accounts and Delegations
You can highlight some data through the conditional formatting.
Before formatting, you must set up conditions in Administration. The topic called Defining Conditions explains the process.
Then, set up the Conditional Formatting tab of the view creation form.
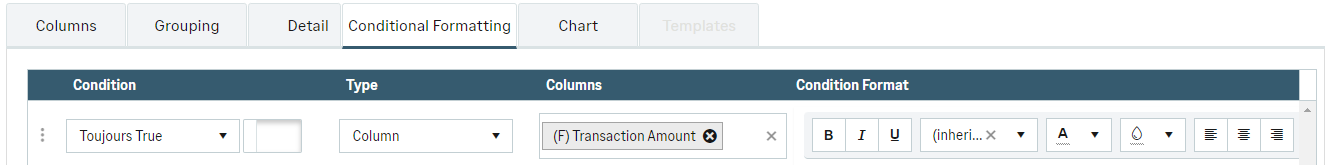
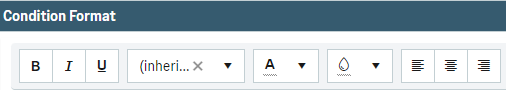
You can personalize and apply the following formatting elements:
-
Font style
-
Underline style
-
Font size
-
Font color
-
Background color
-
Vertical alignment
Select the condition, the line or column element and for this latter element the columns for the formatting application.
The Chart tab enables you to view at a glance all your data and their trends.
Select Only chart or Grid with chart for the Display type field, and then your Chart type:
-
Scatter
-
Pie
-
Polar
-
Radar
-
Donut
Select the first axis from the Category axis dropdown menu and add one or more lines to the Value Axis table.
You can immediately view your chart using the Apply button.
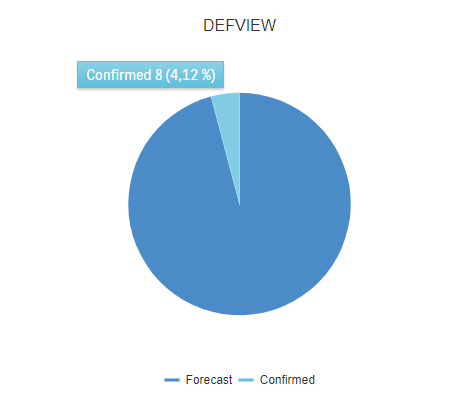
Do not forget to click Save to keep it.