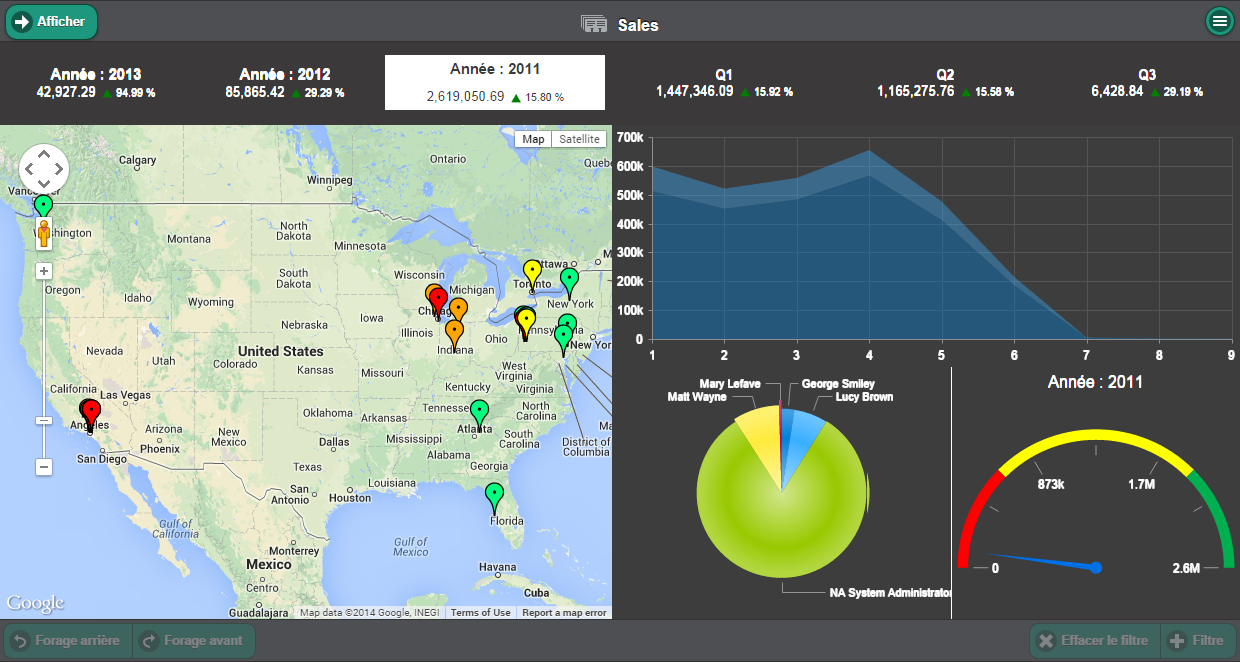
The Dashboard displays one or more views on the same screen.
Worksheets, charts, gauges and maps may be grouped here, even though they result from different processes.
They are defined and managed from Sage Enterprise Intelligence web client.
SEI Mobile enables the application of basic filters on the various views of the dashboard created in Sage Enterprise Intelligence Mobile main web client.
The Dashboard views can be filtered by selecting a worksheet or a chart and clicking the Filter button at the bottom of the screen.
You may also select values from the Dynamic Labels to filter the dashboard.
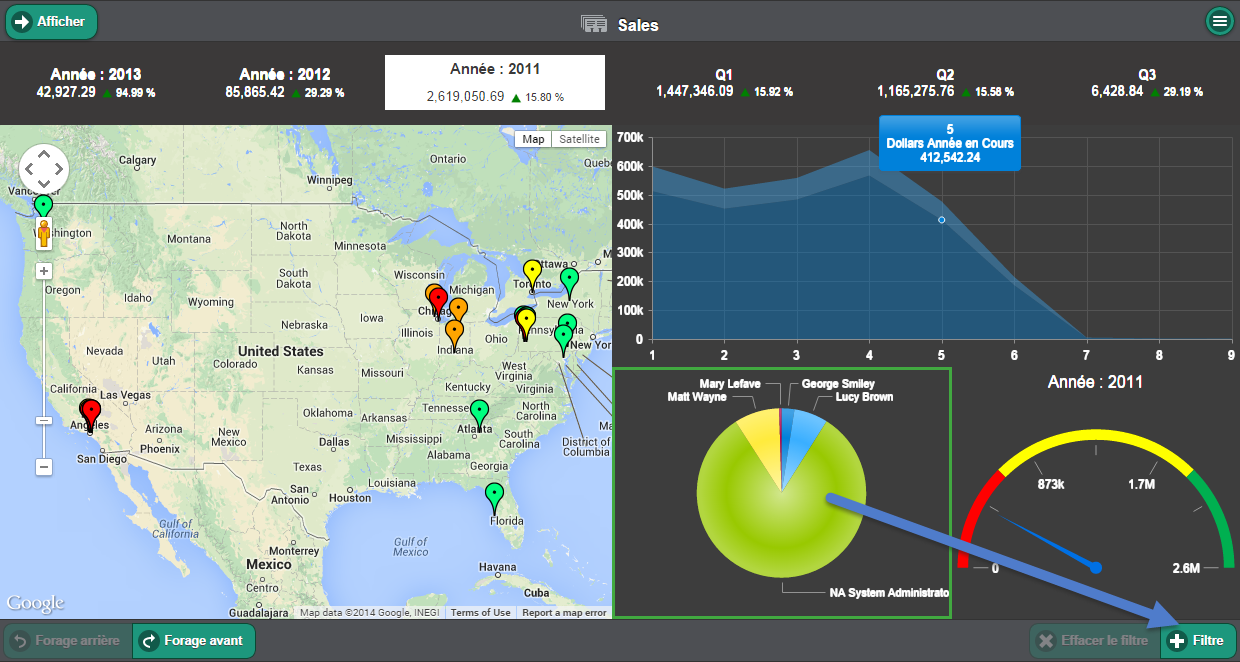
To focus on a level of detail, select a value and use the Drill down function in the lower portion of the page.